Design and Evaluation of a Market Integrity Analysis System for Prediction Markets

Washington University in St. Louis
ESE 4970 Capstone Design, Spring 2026

Abstract

This project studies market integrity in prediction markets through a simulation and detection framework grounded in market microstructure and optimization. Prediction markets operate through event contracts that trade between zero and one, where the price reflects the implied probability of an event occurring. The reliability of this depends on sufficient liquidity, balanced participation, and resistance to strategic interference. In practice, those conditions are often not met, especially in thinly traded markets.

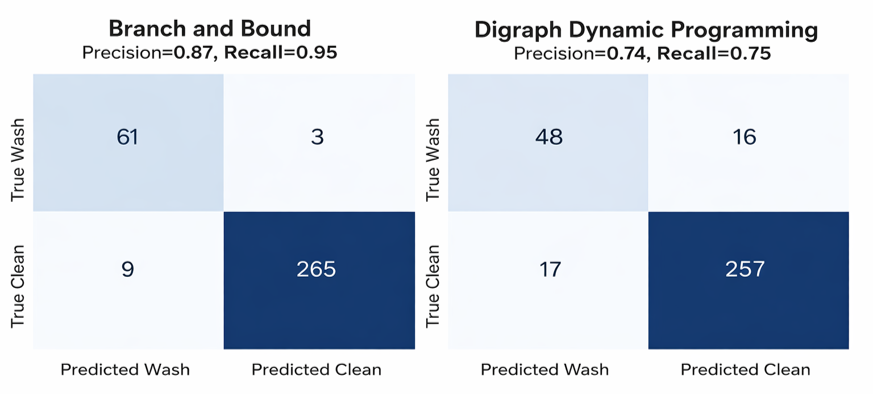
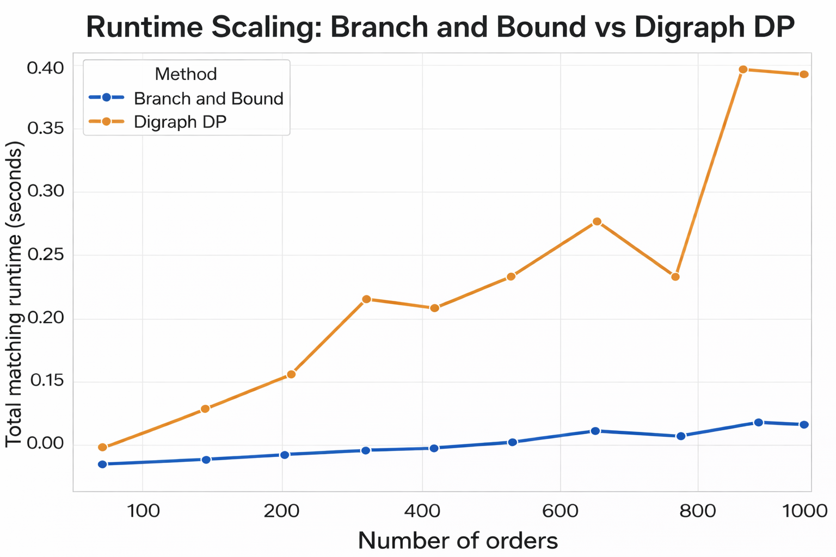
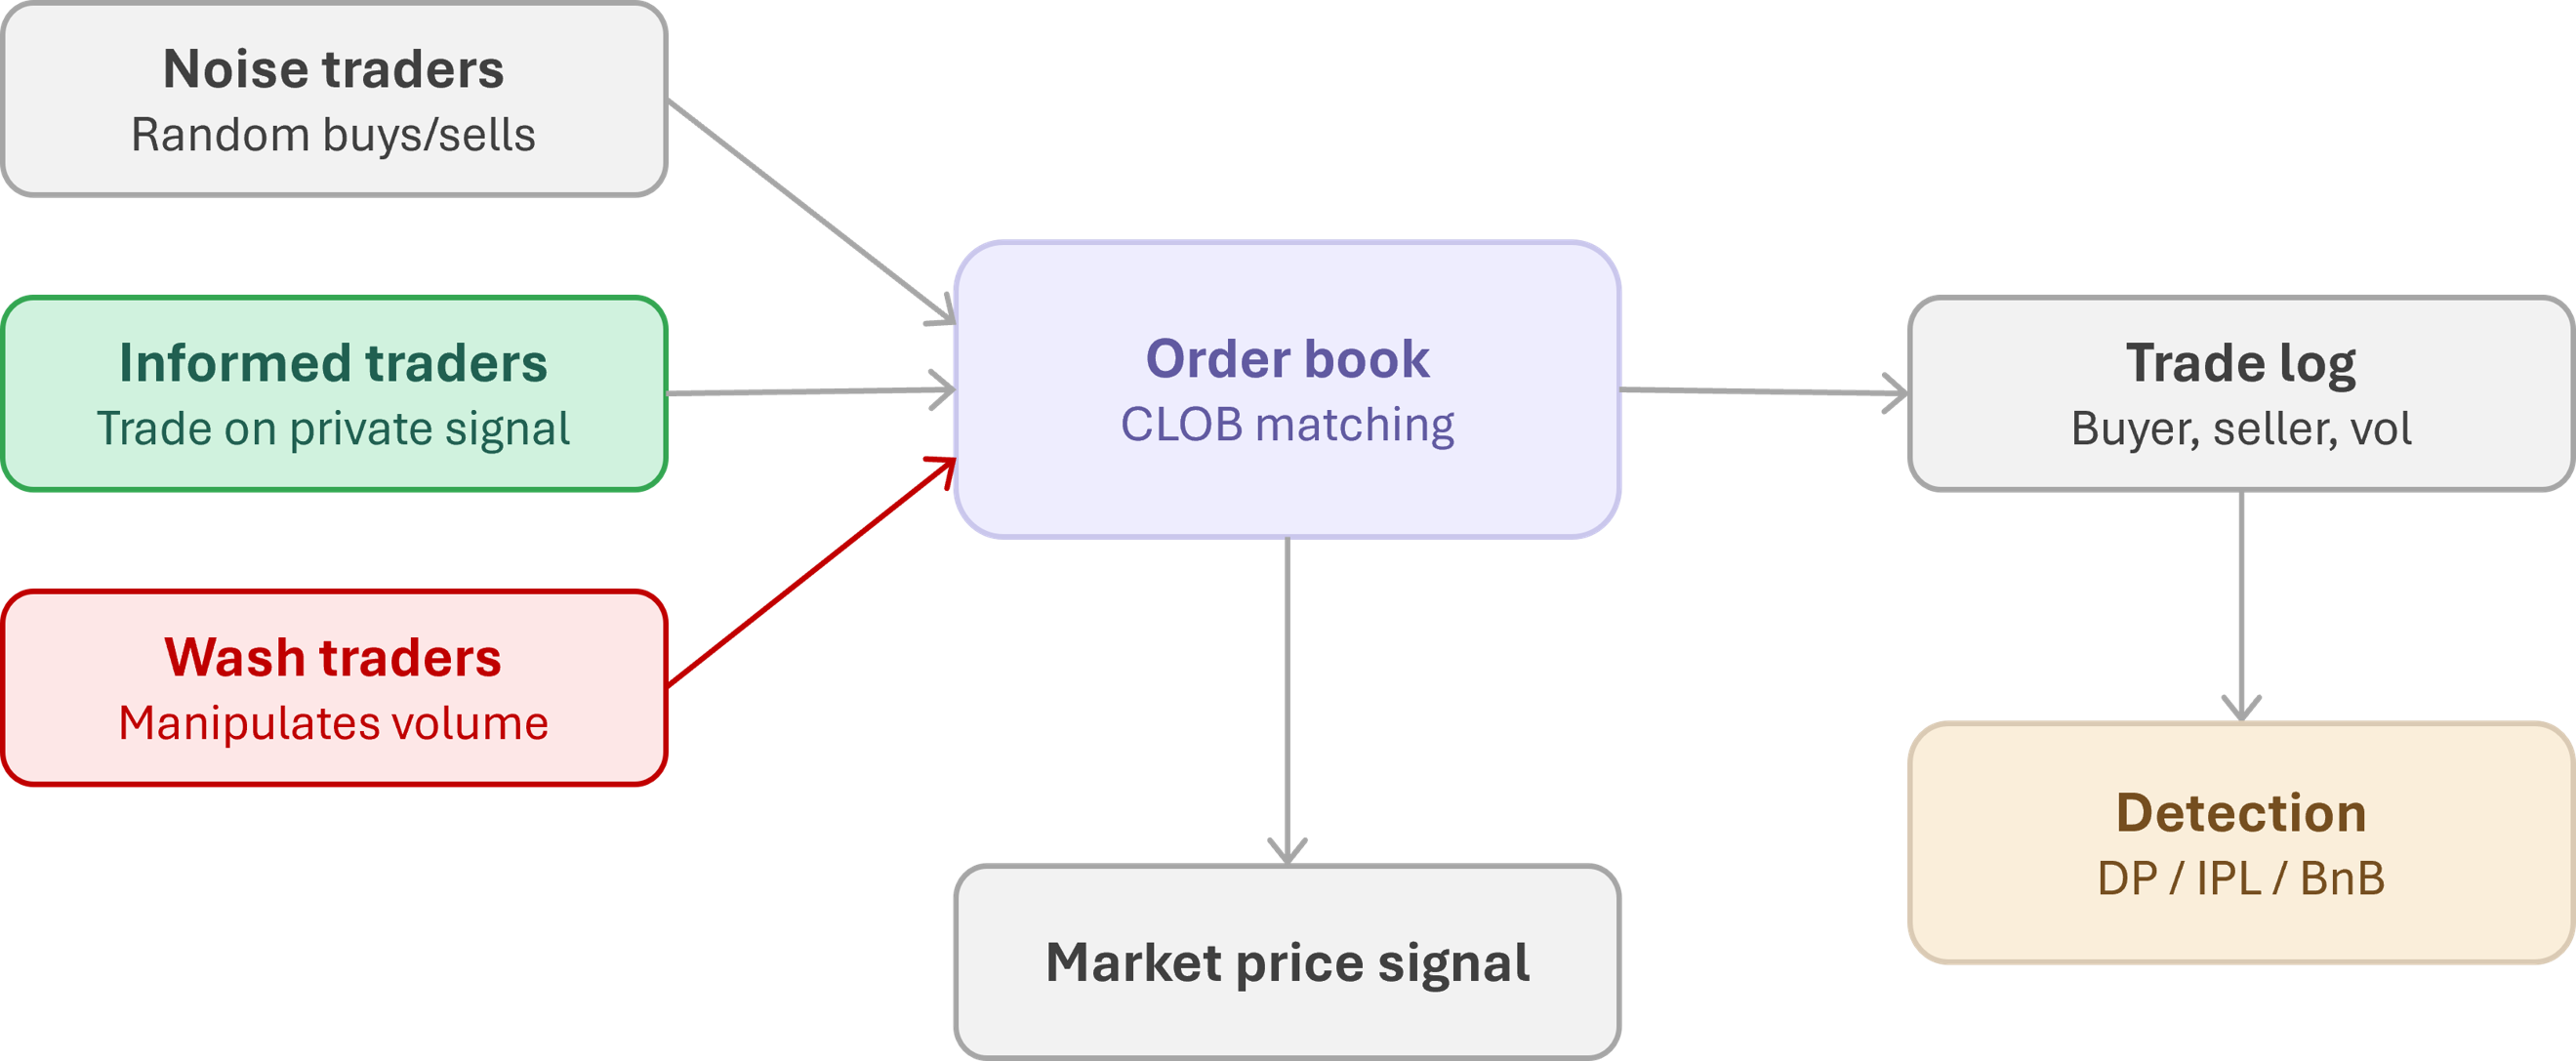
We developed a modular agent-based system using the Mesa framework, structured around a continuous double auction with a central limit order book. The system supports heterogeneous agents including noise traders, informed traders, and multiple classes of strategic manipulators. The central methodological focus is wash trading detection under a fixed structural formulation, comparing Dynamic Programming, Integer Linear Programming, and Branch and Bound. BnB achieves higher detection accuracy and computational efficiency relative to the other methods, with the pruning mechanism allowing large portions of the solution space to be eliminated early based on bounding conditions.

Background

Prediction markets have emerged as a mechanism for aggregating dispersed information into a single market signal through trading activity. Prices are interpreted as implied probabilities of future outcomes. Prior work has shown that prediction markets can perform competitively with, and sometimes outperform, traditional forecasting methods like polling or expert analysis.

Because these probabilities are observable and widely referenced in media, policy discussions, and strategic decision-making, they extend beyond purely financial relevance and can influence perception and belief formation. This creates a feedback loop where market prices don't just reflect beliefs but can also shape them.

Manipulation risk is real. Rasooly and Rozzi demonstrated through a large-scale field experiment that prediction markets are manipulable, showing that even relatively small trades could produce price effects persisting up to 60 days. In low-liquidity environments, fewer counteracting trades exist to correct distortions, allowing manipulative behavior to have a stronger and longer-lasting effect.

Digraph representations of manipulation types
Figure 1: Digraph representations of manipulation types. Left: simple wash trade cycle between two agents. Right: a coordinated multi-agent trading ring forming a closed directed cycle.

Wash Trading

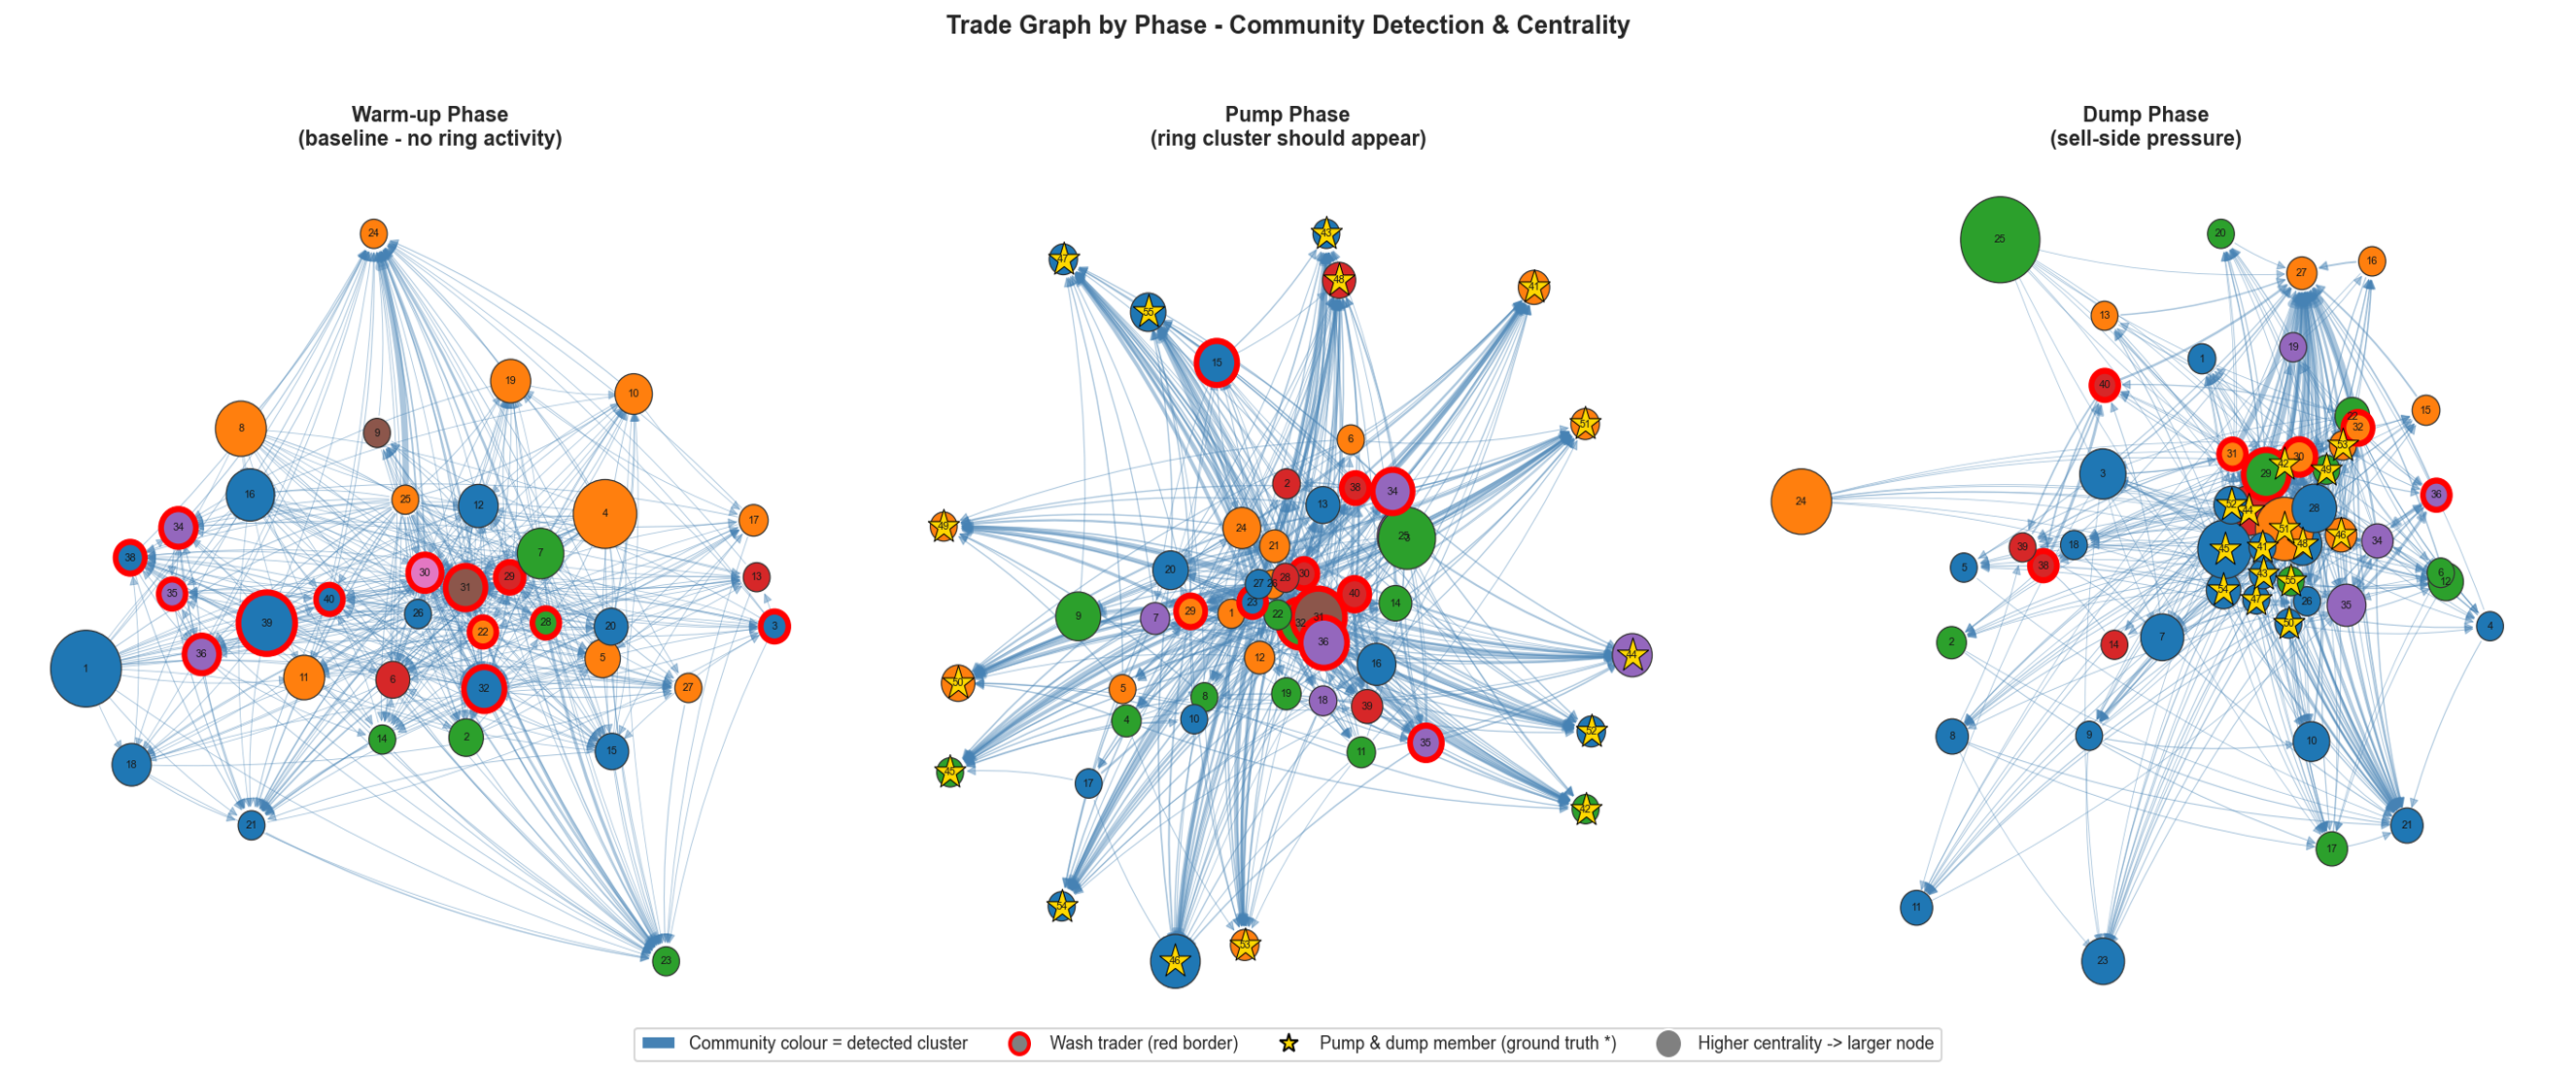
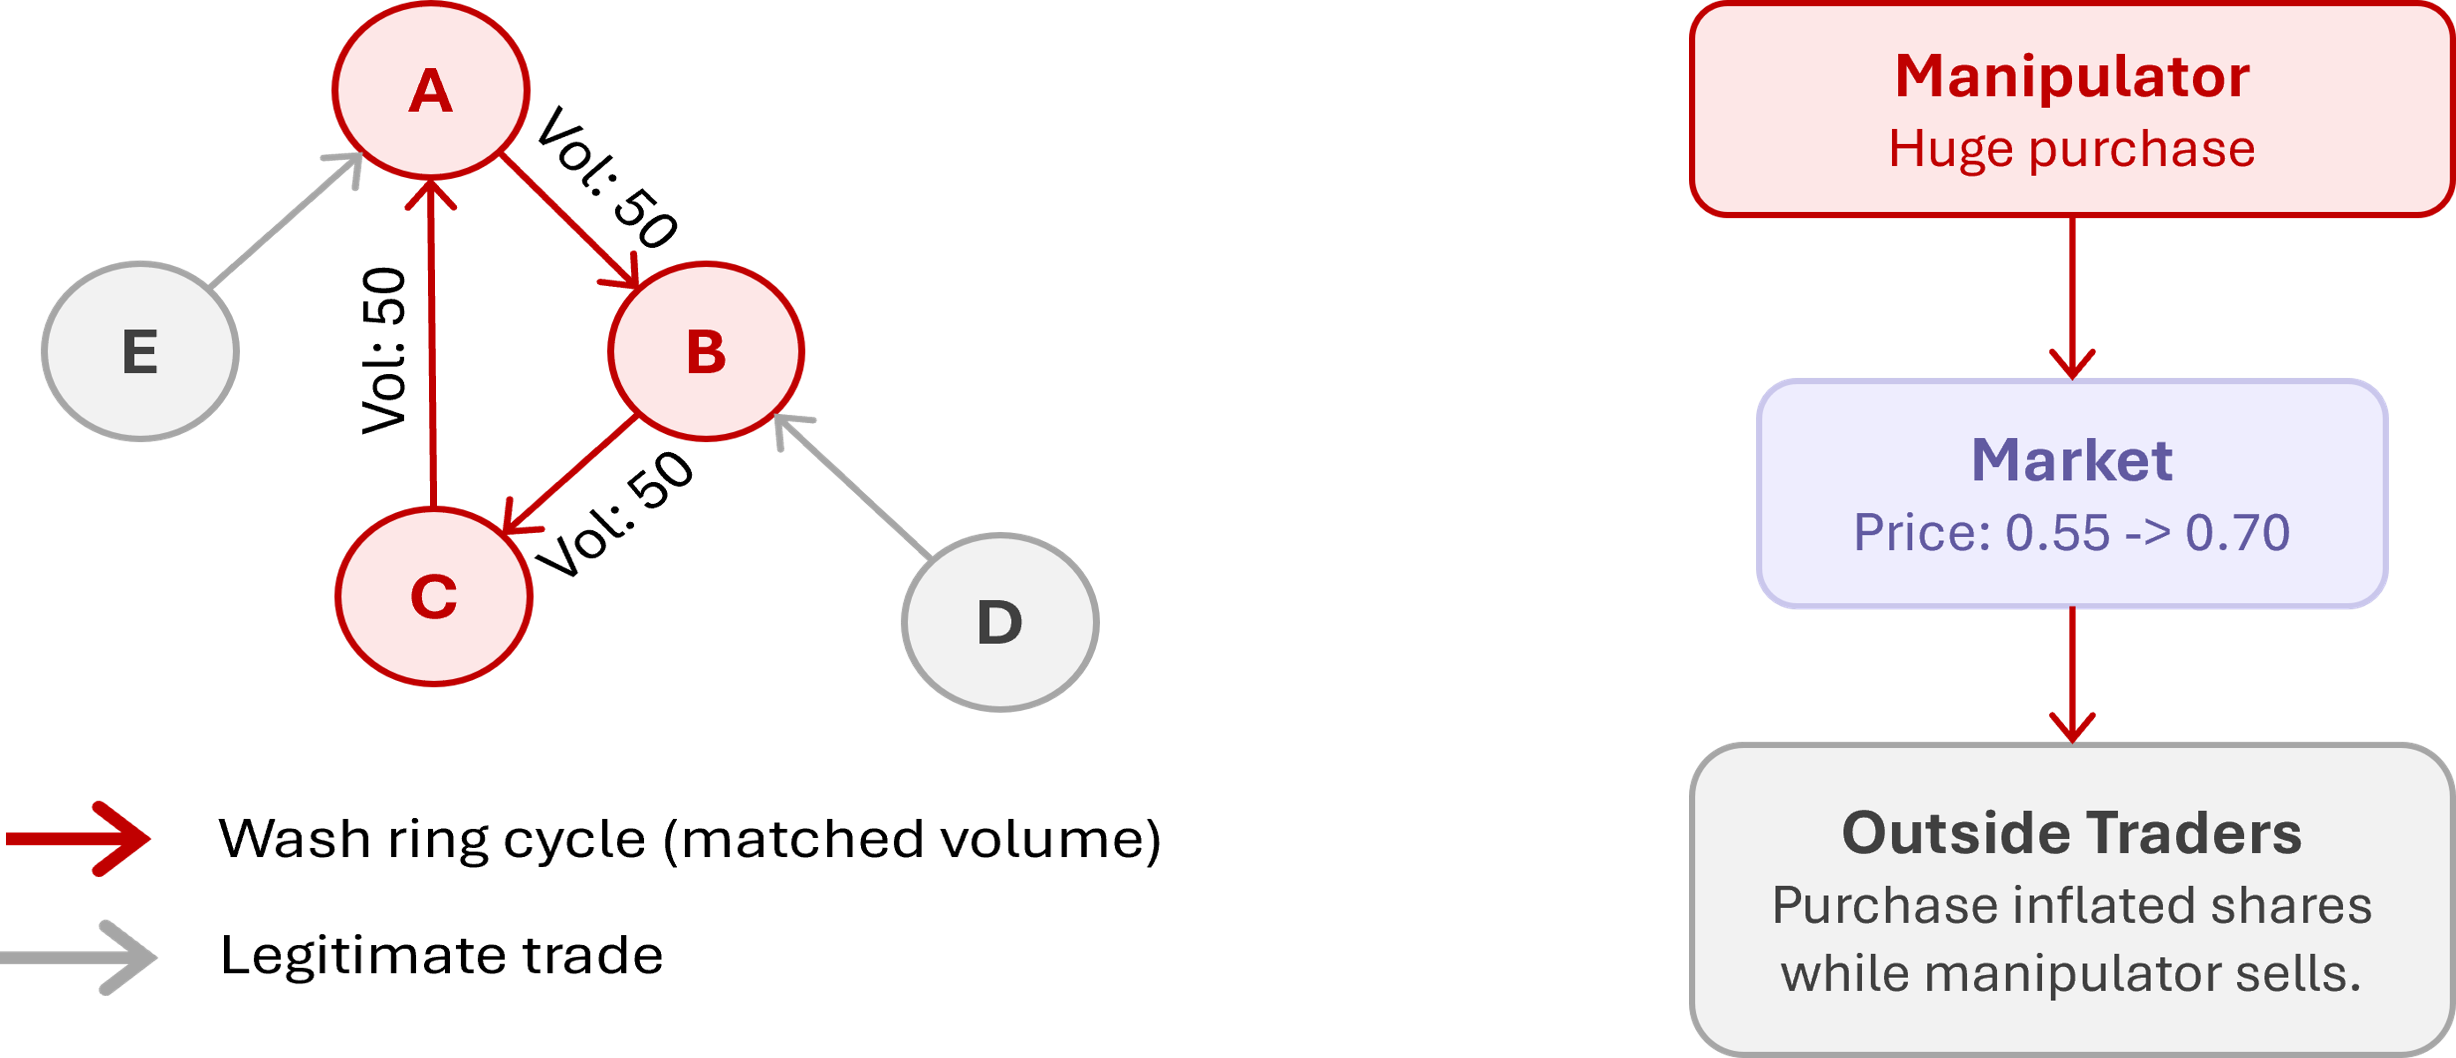
Wash trading operates through cyclic self-matching, where a set of colluding agents trade among themselves in a closed loop. Agent A sells to agent B, who sells back to A, inflating volume without any real transfer of ownership. A more complex variant involves coordinated ring structures where multiple agents form a directed cycle (A → B → C → A). No individual transaction appears suspicious in isolation, but the aggregate structure forms a closed flow of trades.

Pump and Dump

Whale distortion is modeled through a high-capital agent that initiates aggressive buy orders, driving the mid-price upward. This is followed by a reversal phase where the agent exits positions through sell orders once others have responded to the artificially elevated price. Unlike wash trading, which primarily affects volume and trade structure, whale-based manipulation produces a transient shock in price dynamics.

Methods

Agent-Based Simulation

The market environment is implemented using Mesa, replicating a continuous double auction with a central limit order book. The CLOB maintains bids in descending price order and asks in ascending order. The matching engine follows price-time priority. Partial fills are supported. The simulation tracks all executed trades including price, volume, timestamp, and participating agents.

Simulation architecture
Figure 2: Simulation architecture. Agents submit orders to the CLOB, matched trades are logged, and detection algorithms scan the trade log for wash ring cycles and anomalous patterns.

Digraph-Based Detection with Dynamic Programming

The detection framework is built on a digraph representation of trade flows where nodes are traders and directed edges are executed transactions. Wash trading is defined through two properties: trades must occur in tightly matched pairs satisfying constraints on time, price, and volume, and they must collectively form a closed cycle where total signed volume sums to zero. The subset selection problem is equivalent to a knapsack formulation. DP is the baseline, recursively constructing feasible subsets, but the number of possible subsets grows combinatorially.

Integer Linear Programming

The detection problem is re-expressed as an ILP. Each candidate trade gets a binary decision variable indicating whether it's selected as part of a wash structure. The objective maximizes total matched volume across selected trades. The core constraint enforces flow conservation: for each trader, the sum of signed trade volumes must be zero. This directly encodes the structural definition of wash trading from the digraph representation.

Branch and Bound

BnB is applied to the same subset selection problem. It traverses the search space as a decision tree where each level corresponds to including or excluding a trade. At each node, an upper bound on the achievable objective is computed. If this bound is less than the best solution found so far, the branch is pruned. In the implemented system, pruning is particularly effective because trades are pre-filtered based on tight constraints in time, price, and volume, which significantly reduces the number of feasible combinations.

Transient Response Analysis

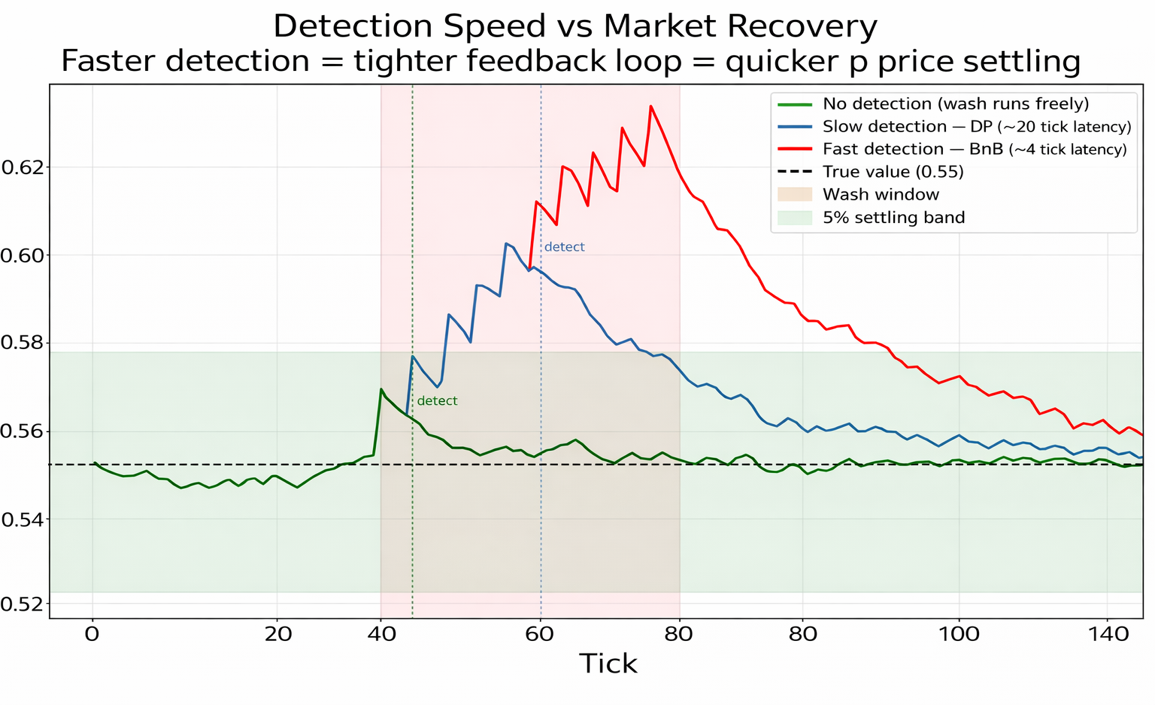
When the whale agent injects a capital shock, the mid-price reacts like a dynamical system getting hit with a step disturbance. Three control theory metrics are used: overshoot (how far above true value the price gets at peak), undershoot (the drop below fair value during the dump phase), and settling time (how many ticks until the price stays within a 5% band around true value).

Power Grid ConceptMarket Equivalent
Steady-state voltageFair-value price (true probability)
Load disturbance / faultManipulation shock
Settling timeSteps until price returns within ε of fair value
Overshoot / undershootMax deviation above/below fair value after shock
System impedancePrice impact per unit manipulation pressure

Timeline

Jan - Feb

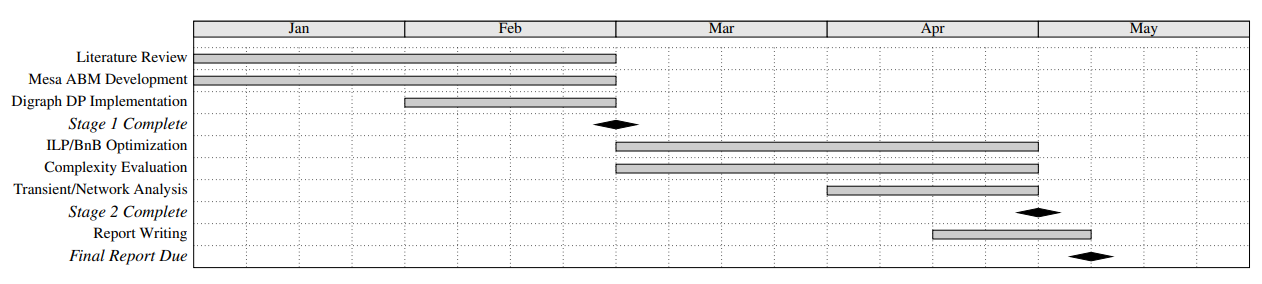
Stage 1: Core Simulation

Literature review, Mesa ABM development, CLOB/CDA implementation, digraph DP detection. Demonstrated computational limitations of DP approach.

Feb - Apr

Stage 2: Optimization and Evaluation

ILP and BnB implementation, complexity evaluation, manipulation regime design. BnB identified as only real-time viable method.

Apr - May

Stage 3: Analysis and Reporting

Transient and network analysis, report writing. Additional time allocated to refining BnB formulation and performance evaluation.

Project Gantt chart
Figure 7: Project Gantt chart showing the three-stage development timeline.

References

[1] Rothschild & Sethi, "Trading strategies and market microstructure: Evidence from a prediction market," J. Prediction Markets, 2016.
[2] Khodabandehlou & Zivari Hashemi, "Market manipulation detection: A systematic literature review," Expert Syst. w/ Appl., 2022.
[3] Cao, Du, & Tse, "Detecting wash trading in financial markets using digraphs and dynamic programming," IEEE CIFEr, 2015.
[4] Chen et al., "Gaming prediction markets: Equilibrium strategies with a market maker," Algorithmica, 2010.

Results

Detection performance, runtime scaling, and manipulation impact analysis

Summary

MetricTargetAchievedMet?
BnB Precision≥ 0.800.87Yes
BnB Recall≥ 0.800.95Yes
DP Precision≥ 0.800.74No
DP Recall≥ 0.800.75No
BnB Runtime (1000 orders)< 100 ms~80 msYes
Wash Ring Price Distortionmeasured5.4%N/A
Whale Overshootmeasured31.2%N/A
Whale Settling Timemeasured> 40 ticksN/A

Wash Trading Detection

95%
BnB Recall
87%
BnB Precision
75%
DP Recall
74%
DP Precision

BnB outperformed Digraph DP on every detection metric. DP relies on structural cycle detection that tends to get bypassed by more complex trading patterns, especially coordinated rings with more than two agents. BnB is better at pruning the search space, and ended up with a recall of 0.95 compared to DP's 0.75, and a precision of 0.87 versus 0.74. Looking at the confusion matrices, BnB only missed 9 wash trades (false negatives), while DP missed 48.

DP enumerates all feasible subsets that satisfy volume constraints, which leads to multiple competing solutions when trade flows are symmetric. BnB prioritizes high-value subsets early through ordering and pruning, allowing it to converge toward structurally consistent cycles that better align with ground truth. The marginal improvement of BnB over ILP (0.87 vs. 0.86 precision, identical recall) suggests both methods capture the same structural constraints, but BnB benefits from more efficient exploration.

Detection accuracy comparison
Figure 4: Detection accuracy comparison. BnB (P=0.87, R=0.95) vs. DP (P=0.74, R=0.75). BnB produces fewer false negatives and fewer missed wash trades overall.

Runtime Scaling

BnB is the only approach that stays under 100 ms across all tested volumes up to 1000 orders. DP runtime grows fast and goes past 300 ms at 1000 orders, making it impractical for real-time use. DP exhibits near-combinatorial growth because it evaluates a large portion of the feasible subset space. BnB maintains near-linear growth due to effective pruning.

Memory usage reinforces this. DP requires maintaining intermediate states for a large number of partial subsets. BnB, by pruning entire branches early, maintains a much smaller active search tree. Real-time deployment requires both low latency and predictable memory usage, and BnB is the only method that satisfies both.

BnB vs DP runtime scaling
Figure 5: BnB vs. DP runtime as order count grows. BnB remains sub-100 ms while DP scales poorly.

Transient Response and Whale Impact

31.2%
Overshoot
15.9%
Undershoot
40+
Ticks to Settle
5.4%
Prob. Distortion

Detection latency directly determines how bad the price distortion gets. BnB catches manipulation in about 4 ticks, keeping overshoot at 1.9%. DP takes about 20 ticks, so overshoot triples to 5.1%. With no detection, the price overshoots by 8.1% and takes 80+ ticks to come back.

The response plots show a clear three-phase dynamic: rapid price increase during the pump phase, sharp reversal, and slower recovery toward steady state. The 31.2% overshoot in uncontrolled scenarios shows how sensitive prediction market prices are to concentrated trading pressure. This confirms that detection is not just a classification problem but a control problem, where response time determines system stability.

Detection speed vs market recovery
Figure 3: Detection speed vs. market recovery. BnB detection (green) keeps overshoot to 1.9%, DP (blue) allows 5.1%, no detection (red) results in 8.1% overshoot. The green band is the 5% settling range around 0.55.

Network and Community Detection

The trade graph analysis shows how market topology changes across the three phases of a pump-and-dump. During warm-up, the graph is spread out with no obvious clusters. During the pump phase, it centralizes around manipulator nodes which build up high degree and betweenness centrality. Community detection algorithms pick out wash traders and ring clusters during this phase. Once the dump phase begins, these structures break down as manipulators exit and trading returns to a more distributed pattern.

Trade graph evolution across market phases
Figure 6: Trade graph evolution across market phases. Left: diffuse warm-up. Center: pump phase with tightly connected manipulation subgraphs. Right: dump phase as structure disperses. Node size reflects centrality.

Conclusions

BnB achieves a recall of 0.95 and precision of 0.87, outperforming the DP baseline across all metrics. It is the only method that satisfies real-time constraints, maintaining sub-100 ms runtime at 1000 orders. Wash trading introduces a price distortion of approximately 5.4%, while whale-based manipulation produces 31.2% overshoot and takes 40+ ticks to settle.

In prediction markets, prices are interpreted as probabilities. Manipulation doesn't simply affect trading outcomes; it compromises the integrity of the forecast itself. Distorted prices lead to distorted beliefs, and in settings where these markets are used as signals for decision-making, the consequences extend beyond the market. Effective detection requires structural, temporal, and behavioral analysis combined with computational efficiency.

Future Work

The framework can be extended to operate on real-time data streams, integrating live order book feeds and evaluating detection performance under real market conditions rather than simulated ones.

Hybrid detection approaches that combine structural optimization methods with temporal and statistical signals would allow the system to capture a broader range of manipulation behaviors, including those that don't form clear graph structures.

The model can also be extended to cross-market settings, where manipulation occurs across multiple related assets or exchanges. This would require integrating multiple trade graphs and identifying coordinated activity across them. Calibration against historical data would improve realism and strengthen the connection between the controlled environment used here and real-world market behavior.

Prediction Market Simulation

A live simulation of a prediction market contract. Inject manipulation and see what happens to the price.

Binary Contract
Will global average temperature exceed 1.5°C above pre-industrial by 2030?
$0.55
= 55% implied probability
Tick: 0 Agents: 48 Mode: Normal Volume: 0 True Value: 0.55
Volume Breakdown
LegitimateManipulation

What's going on

In Normal mode the price bounces around 0.55 from noise and informed traders. Wash Trading injects a ring of agents trading with each other in a closed loop, inflating volume and pushing the price. Pump & Dump has a whale buy aggressively then sell off, creating a spike and crash. Watch the price relative to the green dashed true-value line.

Team & Advisors

ESE 4970 Capstone Design · Electrical & Systems Engineering · Washington University in St. Louis · Spring 2026

Project Team

Al Malik Anand

Al Malik Anand

BS '26, Systems Science & Engineering, Physics, Economics
System architecture, agentic framework design, CLOB/CDA simulation, manipulation regime design, detection framework formulation (digraph, ILP, BnB), analytical framework
Nick Haught

Nick Haught

BS '26, Electrical Engineering, Physics, Computer Science
Algorithm implementation (DP, BnB), software infrastructure, performance engineering, runtime/memory profiling, transient response analysis, scalability testing

Advisors

Ben Wormleighton

Prof. Ben Wormleighton

Faculty Instructor, Electrical & Systems Engineering
Continuous guidance and feedback, problem scope refinement, methodological direction
Yevgeniy Vorobeychik

Prof. Yevgeniy Vorobeychik

Project Client, Computer Science & Engineering
Initial project direction, domain context on adversarial behavior in market systems